Runtime metrics and Grafana dashboards
Brewlet can expose Prometheus telemetry for the control plane, runtime launch path, and node-installed JDK and launcher inventory. This telemetry complements application metrics such as Micrometer, JMX, and OpenTelemetry; it describes what Brewlet itself is doing.
Runtime metrics are disabled by default. Existing installations and upgrades
do not expose these endpoints unless an operator explicitly sets
metrics.enabled=true.
Enable metrics
Enable the three Prometheus scrape surfaces with:
To also create a Prometheus Operator ServiceMonitor and a Grafana
sidecar-discoverable dashboard ConfigMap:
metrics:
  enabled: true
nodePort: 9090
serviceMonitor:
enabled: true
interval: 30s
additionalLabels: {}
grafanaDashboard:
enabled: true
labels:
grafana_dashboard: "1"
For a fresh installation, install Brewlet with the values file:
helm upgrade --install brewlet oci://ghcr.io/microsoft/charts/brewlet \
  --values metrics-values.yaml \
  --set provisioner.pools="{javaworkers}"
This selects the latest released chart and is not an in-place release-update
procedure. For metrics configuration changes to an existing installation, pin
its installed chart version with --version "$BREWLET_VERSION" and preserve
its reviewed values and component choices. Cross-release updates default to
safe teardown/reinstallation under Upgrading and
the pre-GA compatibility policy; this feature declares no
in-place release-pair exception.
Important
metrics.serviceMonitor.enabled=true requires the
monitoring.coreos.com/v1 CRDs provided by Prometheus Operator. The chart
does not install Prometheus Operator.
Note
metrics.grafanaDashboard.enabled=true creates the
brewlet-grafana-dashboard ConfigMap. It does not install Grafana, a
dashboard sidecar, or a Prometheus data source.
metrics.nodePort controls the port exposed by the node-local exporter and its
headless Service. It defaults to 9090. The operator and admission webhook use
port 8080.
Telemetry architecture
flowchart LR
    subgraph node["Each profile-managed node"]
        SHIM["containerd-shim-brewlet-v2"]
        SOCK["/opt/brewlet/metrics/telemetry.sock"]
        EXP["metrics-exporter sidecar :9090"]
        INV[("active JDK and launcher state")]
        SHIM -->|"bounded Unix datagrams"| SOCK
        SOCK --> EXP
        INV -.->|"inventory collection"| EXP
    end

    subgraph control["Brewlet control plane"]
        OP["brewlet-operator :8080"]
        ADM["brewlet-admission :8080"]
    end

    EXP --> NSVC["brewlet-node-metrics"]
    OP --> OSVC["brewlet-operator-metrics"]
    ADM --> ASVC["brewlet-admission metrics port"]

    NSVC --> PROM["Prometheus"]
    OSVC --> PROM
    ASVC --> PROM
    SM["Optional ServiceMonitor"] -.->|"discovers all metrics-labeled Services"| PROM
    PROM --> GRAF["Grafana"]
    DASH["Optional dashboard ConfigMap"] -.->|"sidecar discovery"| GRAF
The Runtime v2 shim sends versioned, bounded-cardinality events as Unix
datagrams to /opt/brewlet/metrics/telemetry.sock. Sending is best-effort, with
a short write deadline. The shim's callers ignore telemetry failures:
observability must never block or fail workload launch.
The metrics-exporter sidecar runs in every profile-managed provisioner
DaemonSet. It receives shim events, exposes them as Prometheus counters and
histograms, and derives inventory gauges from the node's active JDK and launcher
state under /opt/brewlet. It also measures runnable-image stage bytes through
a read-only host mount of /tmp/brewlet-runnable.
The sidecar is deliberately narrow: it runs with a read-only root filesystem,
all capabilities dropped, and no privilege escalation, and it mounts
/opt/brewlet read-only. Its only writable host path is a separate
DirectoryOrCreate mount of /opt/brewlet/metrics, which exists solely so the
exporter can bind the telemetry socket. That volume is present only when the
sidecar itself is — a metrics-disabled or cleanup DaemonSet carries neither.
The read-only stage volume is also omitted without the exporter. Automatic
stage GC runs separately in the provisioner through the host namespaces and
does not depend on exporter mounts or metrics.enabled.
The operator and admission webhook use controller-runtime's Prometheus registry. Their endpoints include standard controller-runtime/process metrics alongside the Brewlet-specific collectors described below.
Scrape surfaces
| Surface | Default port | Scope | Notable telemetry |
|---|---|---|---|
brewlet-operator-metrics |
8080 | Control plane | NodeProfile assigned/ready state, readiness conditions, provisioning transitions, controller-runtime metrics |
brewlet-admission port metrics |
8080 | Control plane | Admitted, denied, errored, and fail-open admission outcomes |
brewlet-node-metrics |
9090 | Each provisioned node | Launch phases/outcomes, artifact resolution, AppCDS decisions, invalid telemetry, JDK and launcher inventory |
brewlet-node-metrics is headless so Prometheus can scrape each exporter pod
instead of aggregating behind one virtual IP.
Verify the Services
kubectl get service -n brewlet \
  brewlet-operator-metrics \
  brewlet-admission \
  brewlet-node-metrics

kubectl get service brewlet-admission -n brewlet \
  -o jsonpath='{.spec.ports[?(@.name=="metrics")].port}{"\n"}'
Scrape the operator
In another terminal:
Scrape the admission webhook
In another terminal:
Scrape one node exporter
Find a profile-managed provisioner pod:
Then forward its exporter port:
In another terminal:
If you changed metrics.nodePort, replace 9090 with that value.
Metric catalog
Runtime and node metrics
| Metric | Type | Labels | Interpretation |
|---|---|---|---|
brewlet_sandbox_launch_duration_seconds |
Histogram | phase, outcome |
Time spent in bounded launch phases: artifact_resolve, bundle_prepare, overlay_setup, runc_create, and process_start; outcome is success or error. |
brewlet_sandbox_launches_total |
Counter | outcome, reason, entry_mode, artifact_format |
Completed launch results. Entry mode is jar, classpath, module, or unknown; format is native, image, or unknown. Failure reasons use a fixed vocabulary rather than raw error text. |
brewlet_artifact_resolution_duration_seconds |
Histogram | backend, artifact_format, outcome |
Time spent resolving content already available to the shim. Backend is layout or containerd; this is not registry pull or cache timing. |
brewlet_cds_regeneration_decisions_total |
Counter | role |
AppCDS decisions: consume, write, defer, or skip. Counts decisions, not proof that the JVM mapped an archive. |
brewlet_telemetry_events_invalid_total |
Counter | None | Malformed, unknown-version, or unsupported shim datagrams rejected by the exporter. |
brewlet_jdk_info |
Gauge | distribution, feature, version, vendor, arch, source |
Value 1 identifies each active JDK build on a node. |
brewlet_jdk_installed_timestamp_seconds |
Gauge | distribution, feature, version |
Unix timestamp when that JDK root was installed on the node. It is not the upstream JDK patch release date. |
brewlet_launcher_info |
Gauge | launcher |
Value 1 identifies an available launcher. Vanilla java is always emitted; additional installed launchers such as jaz are also reported. |
brewlet_runnable_stage_bytes |
Gauge | None | Logical regular-file bytes under the host staging root, including non-evictable unmanaged layouts and pending trees. Refreshed on each scrape without following symlinks. This is not allocated disk space, free space, or reclaimable bytes. |
Stage inspection errors fail the scrape instead of reporting a misleading zero.
Monitor node filesystem free space alongside stage usage; protected, unmanaged,
and pending trees can keep the gauge high even when GC is working correctly.
The exporter's --stage-root and read-only host mount must match the shim for a
custom stage location.
Sweep success/failure counters and last-success timestamps are currently reported in provisioner logs, not Prometheus metrics. The exporter only observes usage; it never deletes stages. See Runnable stage cleanup and the activation checks.
brewlet_sandbox_launches_total uses these bounded failure reasons:
NoCompatibleJDK, NoCompatibleLauncher, NoCompatibleArch,
MissingArtifactReference, ArtifactResolution, OverlaySetup,
RuntimeCreate, ProcessStart, and BundlePreparation. Successful launches use
reason="none".
Control-plane metrics
| Metric | Type | Labels | Interpretation |
|---|---|---|---|
brewlet_admission_requests_total |
Counter | outcome, reason |
Brewlet pod admission outcomes: admitted, denied, error, or fail_open. Reasons are bounded decision/error categories such as none, decode, encode, fleet_unavailable, profiles_unavailable, pending_capacity (admitted with a warning because only a NodeProfile or not-yet-present architecture provides the request), or a compatibility denial reason. Non-Brewlet pods are not counted. |
brewlet_nodeprofile_nodes |
Gauge | profile, state |
Current node counts for each profile, with state="assigned" or state="ready". |
brewlet_nodeprofile_detached_retirements |
Gauge | profile |
Unresolved missing-host cleanup obligations in status.detachedRetirements. A nonzero value can coexist with Ready=True; profile deletion and uninstall stay blocked until it reaches 0. |
brewlet_nodeprofile_condition |
Gauge | profile, reason, status |
Current NodeProfile readiness condition. The active condition series has value 1; previous reason series for that profile are removed. |
brewlet_node_provision_transitions_total |
Counter | state |
Node provisioning state transitions grouped by bounded state. |
PromQL examples
Launch latency
p95 launch latency by phase:
histogram_quantile(
  0.95,
  sum by (le, phase) (
    rate(brewlet_sandbox_launch_duration_seconds_bucket[5m])
  )
)
Average launch phase duration:
sum by (phase) (
  rate(brewlet_sandbox_launch_duration_seconds_sum[5m])
)
/
sum by (phase) (
  rate(brewlet_sandbox_launch_duration_seconds_count[5m])
)
Launches and artifact resolution
Launch outcome rate:
Artifact resolution p95 by backend:
histogram_quantile(
  0.95,
  sum by (le, backend) (
    rate(brewlet_artifact_resolution_duration_seconds_bucket[5m])
  )
)
Admission and provisioning
Admission denials:
Admission errors and fail-open decisions:
sum by (outcome, reason) (
  rate(
    brewlet_admission_requests_total{
      outcome=~"error|fail_open"
    }[5m]
  )
)
NodeProfile assigned and ready counts:
Nodes assigned but not ready:
Provisioning transitions:
AppCDS and inventory
AppCDS decisions:
Installed JDK inventory:
Available launchers:
Malformed telemetry observed recently:
Use rate() or increase() for counters and histogram series when you want
activity over a time window. Query inventory and current-state gauges directly
as instant vectors; applying rate() to brewlet_jdk_info,
brewlet_launcher_info, or brewlet_nodeprofile_nodes does not describe their
intended meaning.
Prometheus Operator integration
When metrics.serviceMonitor.enabled=true, Helm creates one ServiceMonitor
named brewlet. It selects Services in the Brewlet namespace with:
All three scrape surfaces expose a port named metrics, so the same endpoint
configuration covers the operator, admission webhook, and node exporters.
Prometheus installations commonly require labels on a ServiceMonitor before
they select it. Put those labels in:
The required labels depend on your Prometheus Operator deployment. Check the
Prometheus resource's serviceMonitorSelector rather than assuming a label
name.
Bundled Grafana dashboard
When metrics.grafanaDashboard.enabled=true, Helm creates a ConfigMap named
brewlet-grafana-dashboard containing the Brewlet runtime dashboard. Its
labels are configurable so a Grafana dashboard sidecar can discover it.
The bundled dashboard includes:
- sandbox launch p95 latency by phase;
- sandbox launch outcomes;
- admission denials;
- NodeProfile readiness;
- AppCDS decisions;
- installed JDK inventory.
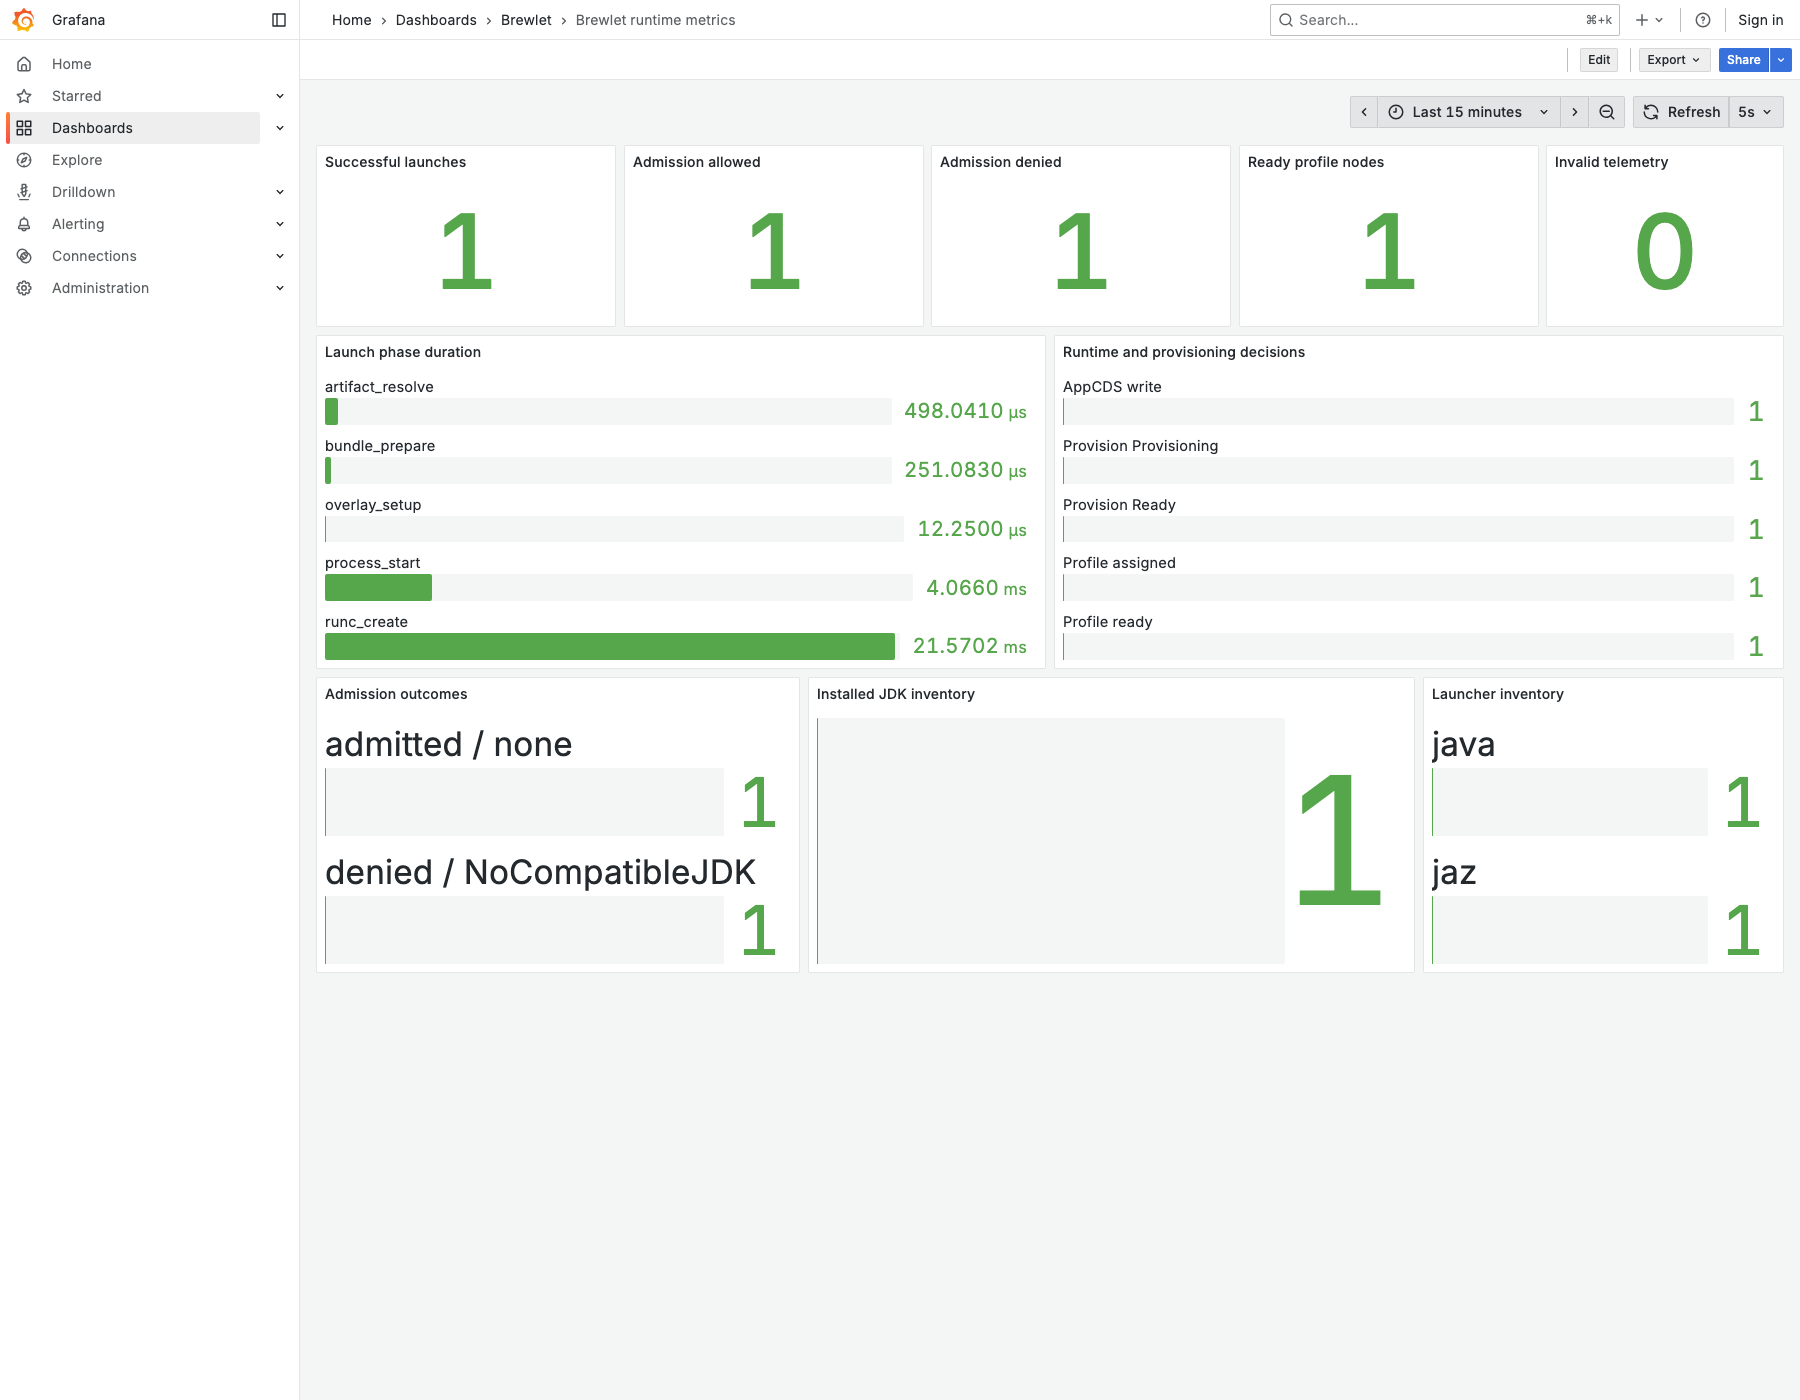
The bundled Brewlet runtime dashboard populated by live integration-test telemetry.
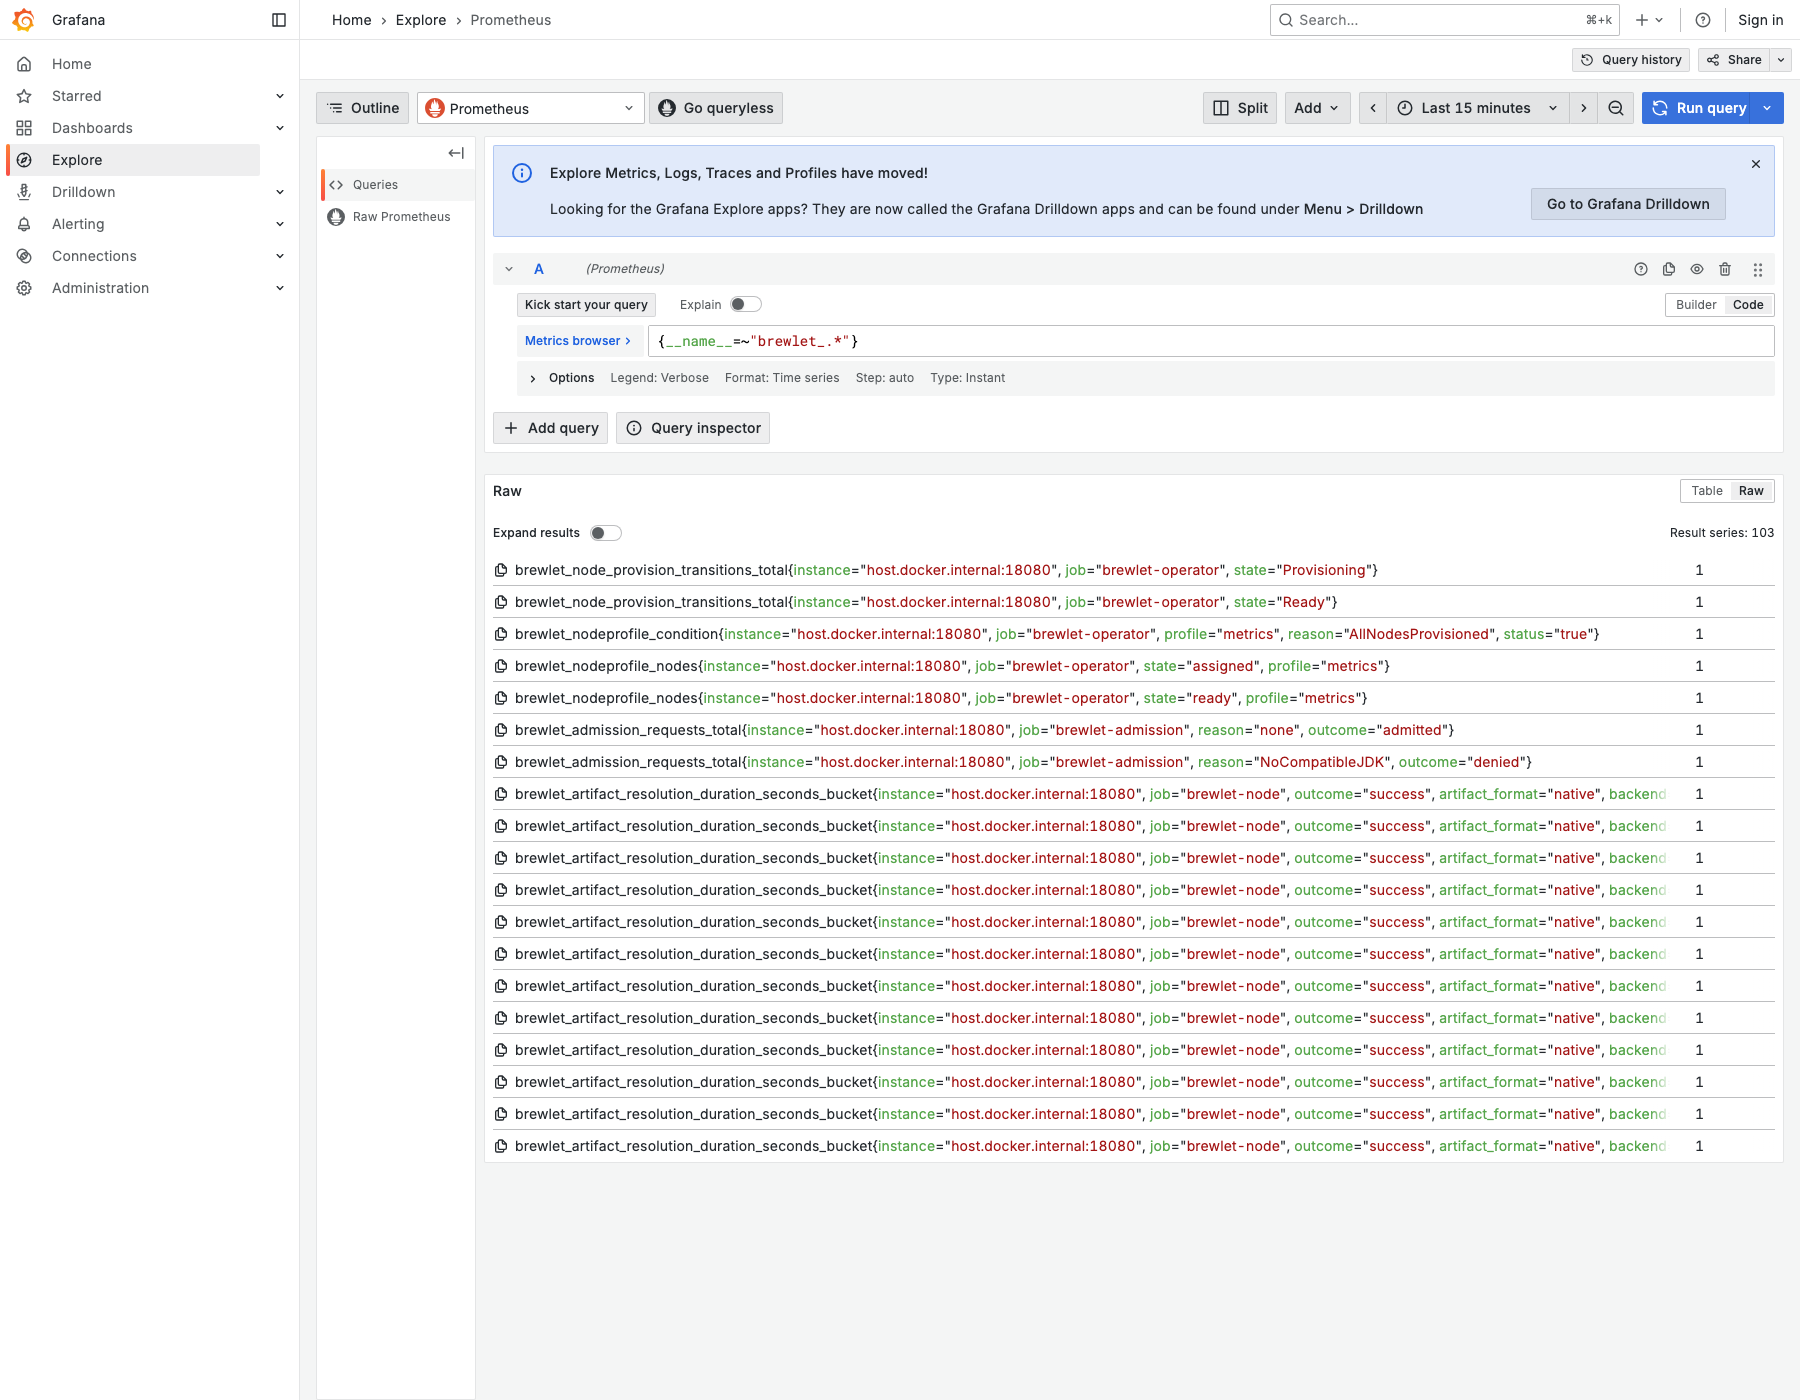
Brewlet metrics inspected directly in Grafana Explore.
These captures used Grafana 12.1.0 backed by Prometheus 3.5.0. They document the tested setup, not minimum supported versions.
If the dashboard appears but panels have no data, verify that Grafana has a working Prometheus data source and that it points at the Prometheus instance scraping Brewlet.
Operational signals
The right thresholds depend on workload volume, cluster size, and your normal provisioning behavior. Start by graphing these signals and establish a baseline before attaching alerts:
- non-zero increases in
brewlet_telemetry_events_invalid_total; - the failed launch ratio and its bounded failure reasons;
- sustained admission
errororfail_openoutcomes; - NodeProfiles with assigned nodes that do not become ready;
- unexpected or repeatedly changing provisioning states;
- missing JDK or launcher inventory after a profile reports ready;
- changes in AppCDS decisions after JDK installation or patching.
Cardinality and privacy
Brewlet's telemetry contract intentionally uses bounded labels. It excludes pod names, artifact references, digests, arbitrary error text, and other workload-specific identifiers. This both controls Prometheus cardinality and avoids leaking workload identity through the metrics surface.
Aggregate the provided labels instead of relabeling in pod names, image references, digests, or unbounded error messages. Use Kubernetes events and component logs when you need to investigate an individual workload.
Troubleshooting
Metrics Services are absent
Confirm that the installed release has metrics enabled:
With metrics disabled, the chart does not create
brewlet-operator-metrics or brewlet-node-metrics, does not add the admission
metrics port, and configures the operator and admission metrics bind address as
0.
The node target is absent
Check the profile-managed DaemonSet and its exporter sidecar:
kubectl get daemonset -n brewlet
kubectl get daemonset <profile-daemonset> -n brewlet \
  -o jsonpath='{range .spec.template.spec.containers[*]}{.name}{"\t"}{.command}{"\n"}{end}'
The second container should be named metrics-exporter and run:
Then check that the DaemonSet has ready pods on the expected nodes:
Runtime counters remain empty
The socket is node-local and is created by the exporter:
Verify it from the exporter container:
kubectl exec -n brewlet <provisioner-pod> -c metrics-exporter -- \
  test -S /opt/brewlet/metrics/telemetry.sock
Inspect the exporter sidecar logs:
If the socket is missing and the logs report a read-only filesystem, confirm the
sidecar still has its writable /opt/brewlet/metrics mount alongside the
read-only /opt/brewlet one:
kubectl get daemonset <profile-daemonset> -n brewlet \
  -o jsonpath='{range .spec.template.spec.containers[1].volumeMounts[*]}{.mountPath}{"\t"}{.readOnly}{"\n"}{end}'
No launch samples are expected until Brewlet workloads run on that node. Telemetry delivery is best-effort, so workload success does not guarantee that every event was observed.
Inventory is empty
JDK inventory is based on the node's active Brewlet state. Confirm that the NodeProfile is ready and that the provisioner completed:
kubectl get nodeprofile
kubectl describe nodeprofile <profile>
kubectl get nodes -L brewlet.sh/runtime
An unready profile or a node with no active JDK state can legitimately expose no
brewlet_jdk_info series.
Prometheus does not discover the targets
Check the ServiceMonitor, its selector, and Prometheus target status:
kubectl get servicemonitor brewlet -n brewlet -o yaml
kubectl get service -n brewlet -l brewlet.sh/metrics=true --show-labels
Verify:
- the Prometheus Operator CRDs exist;
- the
ServiceMonitorhas any labels required by the PrometheusserviceMonitorSelector; - Prometheus watches the Brewlet namespace;
- each selected Service exposes a port named
metrics; - NetworkPolicies permit Prometheus to reach the endpoints.
Grafana does not load the dashboard
Inspect the ConfigMap and compare its labels with the dashboard sidecar configuration:
The default discovery label is grafana_dashboard: "1", but your sidecar may
expect a different key or value. Also confirm that Grafana has a Prometheus data
source; the ConfigMap supplies only dashboard JSON.
Implementation validation
The Brewlet monorepo's
integration-tests/e2e/tier15-metrics-incluster.sh
exercises the live operator -> provisioner -> shim -> exporter path, all three
scrape surfaces, inventory collectors, and runtime events. It is implementation
validation for contributors, not an end-user installation procedure.
Next steps
- Observability & day-2 operations - application-level observability and general fleet operations.
- Configuration - the complete Helm and component configuration reference.
- Troubleshooting - broader installation and runtime failure modes.